
I applied the same concept from the team statistical rankings to Quarterbacks: taking their ranks in important statistical categories and averaging out the ranks to find a single overall average. Then we calculate the median, and then list how far above or below the median each quarterback is.
The 10 stats I used:
- Passing TDs: self-explanatory.
- INT%: Instead of tracking total INTs, I wanted to be more precise and track how likely a QB is to throw an INT on a given dropback. I use INT% because INTs can happen on basically any play. Sure, a TD can technically happen on any play, but they’re more likely to happen closer to the opponent’s endzone. This is why I use total passing TDs instead of TD%, and INT% instead of total INTs.
- QBR: Measures a QB’s total contributions to his team’s winning or losing. Considered a more “holistic” measure of a QB’s performance than the standard QB Rating, which has been around since 1973. Accounts for things like running the ball, fumbles, sacks and throwing distance. Calculated and expressed on a scale of 1-100, which should be thought of as a percentage showing two things: the QB’s team’s expected chance of winning given his performance, and how the QB’s performance stacks up to all past QB performances since 2006.
- QB Rating: rewards QBs for having a high completion percentage, a high yards-per-attempt, a high TD/Passing Attempt percentage and no interceptions. Purely measures passing ability.
- Yards-per-game: self-explanatory.
- Yards-per-attempt: tells us how productive a QB is every time he throws the ball, not just when he completes a pass. Rewards efficiency.
- ANY/A (adjusted net-yards per attempt): ANY/A is simply yards per attempt, but includes sacks and sack yardage lost, and provides a 20-yard bonus for touchdowns and a 45-yard penalty for interceptions.
- On Target %: Percentage of throws that are considered “on target.”
- Fewest Bad Throw %: The lower the number the fewer bad throws.
- Completion percentage: self-explanatory.
The lower the average the better, as it means you’re highly ranked in more categories.
There are only 31 QBs on the list because in order to qualify you have to be in the top 32 in terms of passing attempts this season. Dak Prescott is still in the top 32 in passing attempts, and no Cowboys QB has surpassed him thus far. Once Dalton does, he’ll be included in the rankings.
The top 10:

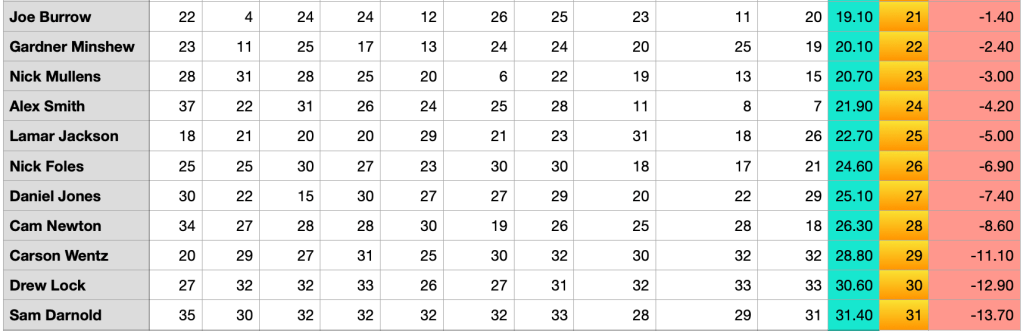
The second tier:

And the bottom tier:
You can see Aaron Rodgers is ranked a bit ahead of Mahomes. It’s basically a toss-up between the two in most people’s eyes, but I have Rodgers ranked higher mainly because Mahomes has had more bad throws.
Josh Allen is my #3 QB, with DeShaun Watson next, Drew Brees at 5 and Russ at #6.
People might be surprised to see Drew Brees at #5, as the running joke this season has been that he can’t throw the ball more than 10 yards anymore. But he actually ranks middle-of-the-pack in Y/A and 6th overall in ANY/A. He’s #1 in completion percentage, which people will say because of all the short passes. That may be true, as QBs with the lowest average intended air yards per attempt tend to have higher completion percentages (Alex Smith, Nick Mullens, Jared Goff). But having a high intended air yard average isn’t inherently a good thing. Here are the top 4 in the league in terms of average intended air yards per pass: Joe Flacco, Drew Lock, Mitch Trubisky and Carson Wentz.
Speaking of Carson Wentz, he’s the 28th ranked QB in the league. Many people would say this is because the guy is getting sacked every other dropback. And it’s true: he does get sacked a hell of a lot. He leads the league in being sacked. But would you believe that, per Next Gen Stats, Wentz is actually tied for 6th in the league in time to throw? Yes, he’s had a litany of offensive line injuries, but he’s been getting time to throw. He’s either waiting too long to get rid of the ball or his guys just aren’t getting separation. Philly’s receivers do not rank well in terms of yards of separation, but I’m sure it’s probably a combination of both.
A notable name that is ranked low: Tom Brady at #19. He’s had a tough time adjusting to the Bruce Arians offense. I personally don’t think it suits his strengths as Arians wants to go for home runs a lot and that’s not really what Brady is all about. Brady is all about the short, precision, timing routes and dissecting a defense rather than going for it all on one play. But where Brady really looks bad is in bad throws: he’s second-worst in the league. That’s on him, not his coaching staff. He’s also 23rd in on target pass percentage. Again, that’s on him.
Ben Roethlisberger is ranked 11th despite having the most dropped passes of all QBs this season (33). It’s also worth noting that Aaron Rodgers’ receivers have dropped 27 passes, which is good for 3rd-most in the league. Brady’s receivers have dropped the 5th most passes, 25.
***
As for the statistical ranking system itself, I’m open to suggestions for improvements and weighting. For instance, placing double weight on TDs or something like that.
