
I overhauled the formula for my college football power rating system. At first, I was only evaluating the teams in the AP Top 25, but now that I’ve figured out how to scrape data from sports data websites, I am now able to evaluate all 130 teams in the FBS.
This makes the system a lot more accurate because it does not presuppose that the teams in the AP top 25 are the top 25 teams in the country. As we’ll see shortly, my power ratings vary significantly from the AP Top 25–there are a lot of teams in my top 25 that aren’t in the AP Top 25, and vice versa.
I also streamlined the criteria and tweaked the formula.
The first thing is that strength of schedule is now weighted normally as opposed to doubly. I just figured that I didn’t want the ratings to be based predominantly on record, but based on per-game performance. It’s supposed to be forward-looking, not backward. I still do incorporate wins and losses in the form of strength of record and strength of schedule, but as I went over in yesterday’s College Football recap post, wins and losses honestly don’t give us the full story of a team.
Here is the new formula:
- Talent (triple weighted): I base the team’s overall talent level on 247’s composite team talent ratings, which are based on the recruiting grades of the players on each roster. It’s triple-weighted because talent is the most important single factor in college football. News flash: the team with better players usually wins. This is also a reflection on coaching, because recruiting is a big part of coaching.
- Net points per game (double weighted): Points scored per game minus points allowed per game. There’s no better indicator of a team’s dominance than average margin of victory.
- Net yards per game (normal weight): Total offensive yards gained per game minus total opponent yards allowed. Net yards supplements net scoring and gives us a more complete picture of how dominant a team is: if they’re winning big and significantly out-gaining their opponents, then we know they’re more likely to be legit.
- Net YPP (normal): Team’s average YPP minus average YPP allowed. This is more of an efficiency metric because it filters out things that can possibly skew net yards per game like time of possession, pace and big plays. It tells us how many yards a team gains on an average play compared to how many yards they allow their opponents to gain on an average play. There is a very high correlation between net yards per play and how good a team truly is. If you win the net YPP battle by more than 1.0 yards per play, you have an 86% chance of winning the game. The best teams the nation are averaging 2-3 net YPP right now.
- Net turnovers per game (normal): Turnovers forced minus team’s turnovers per game. This tells us which teams take care of the ball best, but more than that, it also tells us which teams we may be overlooking. How so? Let’s take a team like Florida for example: even though UF is unranked, I have them as the 11th best team in the nation. ESPN’s FPI is even more bullish on the Gators and has them at 7. But they’re not even ranked! They’re just 4-3 right now! Well, Florida lost to Bama by 2, Kentucky by 7 on the road, and LSU by 7 on the road. Those are not losses to really be ashamed of. Okay, so what does this have to do with turnovers? Well, Florida ranks 121 out of 130 in turnovers per game. They’ve been unable to take care of the ball; or, if you’re someone who views turnovers as largely luck-based (and there’s a lot of data indicating they are given that you cannot rely on getting takeaways game-over-game–ahem, Iowa, ahem), then you can look at Florida’s turnover situation as a result of poor luck and conclude that they’re actually being seriously underrated. Teams that win the turnover margin win 72% of the time. Florida is really good in almost every category other than turnovers.
- Net Big Plays per game (normal): Big plays made per game minus big plays given up per game. I classify a big play as a gain of 20+ yards. Now there’s some debate over whether or not you should use a different yardage number for run plays compared to pass plays (for example runs of 12+ yards and passes of 20+ yards) but I use 20+ yards for both. I mean, whether it’s a run or pass, it still counts for the same amount of yards, right? Winning the big play battle is enormous in deciding games. Think of it this way: if you’re at the opponent’s 45 yard line, and you’re obviously looking to score a TD, what’s the easiest way to score a TD? Is it to pick up 4 first downs to set up a first and goal inside the 5? Or is it preferable to just score a 45 yard TD on one play? Obviously the big play is preferable. It’s because the more plays you run, the more things can go wrong. You have to worry about picking up first downs and turning the ball over. Big plays simply mean you’re more likely to get a TD on a given drive. If you can get big plays and prevent the opponent from getting them, you’re probably going to win the game. I mean think about it: what is the best possible outcome on any given offensive play? A touchdown.
- Strength of Record (normal): This is basically telling us how likely is it that an average top-25 team would have the same record as you (or better) if they played your schedule. It tells us how impressive a team’s record is based on opponents played. This is a way to incorporate losses and records into the formula.
- Strength of Schedule (normal): It’s nice if you’ve got really good stats as a team, but the real question is, who have you played? If you put up great stats against weak competition, we have to hold that against you. Conversely, if you’ve put up impressive numbers against strong competition, then we have to take that into account and give you more credit for it. It’s not just about what kind of numbers you put up: it’s about who you put them up against. Ohio State, currently my #3 rated team, would be nearly tied with #1 Alabama if we did not incorporate strength of schedule. But Ohio State hasn’t really played anybody good–well, they’ve played Oregon, but they lost. Ohio State has the 92nd ranked strength of schedule. They’re ranked incredibly highly in just about everything else, but they just haven’t played a tough schedule–at least not yet.
- Game Control (normal): This is a dominance metric. It’s a strength of schedule-adjusted metric that looks at how much of a game you’re in the lead for. It goes deeper than margin of victory, which only looks at the final score. Let’s take this week’s Alabama-Tennessee game, for example: Alabama won 52-24, which looks like a dominant performance on paper. But they were only up 24-17 going into the 4th quarter. Alabama led for most of the game, but they were not exactly in control for most of the game. When you’re up by one TD with a full quarter remaining, that is not being “in control” of a game. Margin of victory would tell you that Bama was extremely dominant against Tennessee. Game Control would say, well, not as dominant as you might think. On the other hand, in Ohio State’s game against Indiana, they were leading 37-7 at halftime. That’s being in control. Now of course Tennessee is a tougher team than Indiana, and that’s why the Game Control stat adjusts for strength of opponent.
- Average In-Game Winning Percentage (normal): This is another dominance metric. It simply takes your in-game winning percentage from every game, averages it out, and adjusts for strength of opponent. It’s similar to game control, and it tells us a lot about how many lead changes happen in your games. But while Game Control is somewhat subjective, Average In-Game Winning Percentage is all numbers-based.
- Special Teams Rating (normal): This is a catch-all statistic for special teams play. According to Football Outsiders: “Special teams Fremeau Efficiency Index ratings (STR) combine kickoff return, kickoff, punt return, punt, field goal, and opponent field goal efficiency into one overall rating, represented as the team’s standard deviation above or below average.” It tells us how reliable your special teams are. We cannot overlook special teams. It’s one of the three phases of the game. Obviously it’s not as important as offense and defense, but it is important and must be factored in. Oftentimes special teams can make the difference in a close game–think field goal kicking, coffin-corner punting, return yardage, etc.
- Net Field Position (normal): Now at first glance this might seem to be another special teams stat, but that’s only partially true. Net field position is heavily influenced by both a team’s offense and defense: if you punt it and pin a team inside their ten, and then your defense holds them to a three and out, when they punt, you’re going to get some great field position. If your offense gets the ball at the 20 and moves the ball down the field but has to punt around the 45 or 50, then there’s a higher likelihood you’re going to pin the other team deep in their own territory. So net field position tells us about a team’s offense, defense and special teams. Field position is something people rarely talk about, but it’s often one of the deciding factors in a game. If the other team is constantly starting drives inside their own 20, while you’re starting them north of your own 25 or even 30 yard line, it’s going to be harder for them to score on you and easier for you to score on them. The chances of a given drive ending in a TD are based a lot on field position–it’s easier to score on a 50 yard drive than it is to score on a 90 yard drive. Net field position tells us whether a team consistently gets good field position while forcing its opponent into bad field position. It’s a dominance statistic.
So these are the stats I use to evaluate teams. Again, I rank the teams 1-130 in all those categories, then average out all the team’s rankings, and then finally subtract the number from 131 to make it easier to understand. I wanted to simply subtract the number from 101, but because there are 130 teams in the FBS, it meant some teams would be in the negative, and that’s just not really ideal.
I use 131 because the best a team can ever be is #1 in all categories, so a 130.0 is the highest a team can be, and the lowest you can be is a 1.0.
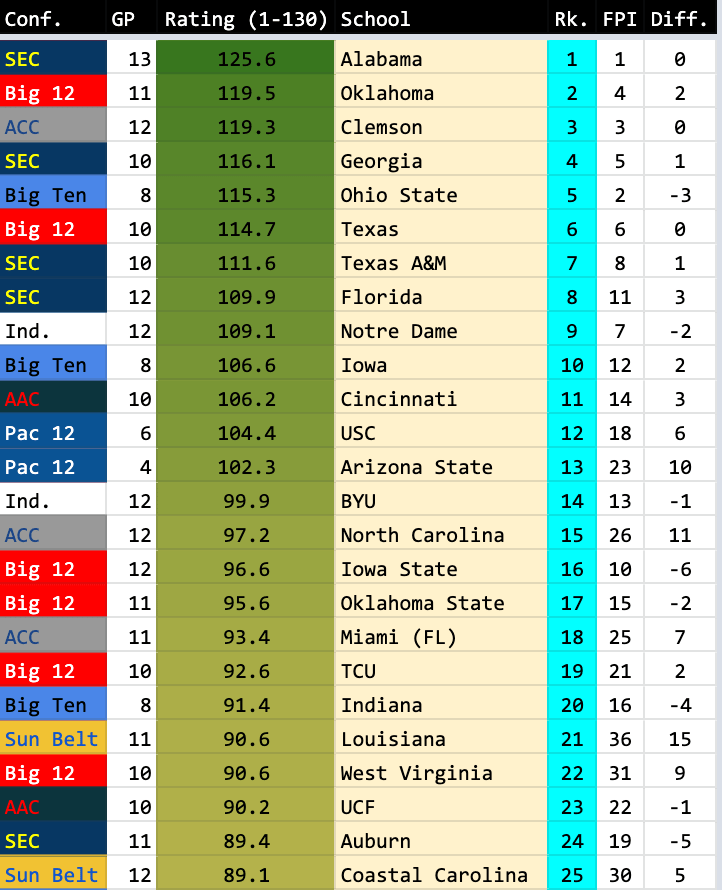
Here is my top-25 through week 8. I included the ESPN FPI rank right next to my rankings as well as the difference between the two just for comparison:

My top-4 and FPI’s top-4 is almost the same. I have Bama #1, they have Georgia #1. Ohio State at 3, Michigan at 4.
As I said earlier, Ohio State would be right there with Bama if I didn’t adjust for strength of schedule, but I do.
Then come the big surprises: Baylor at #5 and Oregon at #6. FPI ranks Baylor 22 and Oregon 19.
I’m very high on Pitt, but FPI likes Pitt even more. FPI has Pitt #6 in the nation.
My rankings like Tennessee a lot but hate Oklahoma. Oklahoma just isn’t elite in any category, really.
Now for 25-50:

Nebraska is a surprise at 26. FPI likes them even more than my ratings do, as FPI has them 21. It’s interesting because Nebraska is 3-5 this year.
My ratings do not like Notre Dame, but the biggest discrepancies here are Iowa State and Clemson.
FPI has Iowa State all the way up at 8, but I have them 35. FPI has Clemson 10, I have them 37.
A big part of this is that my ratings just take into account what a team has done this season, while FPI, because it starts in the preseason, takes a lot of what a team did last year into account.
Clemson is not good this year. They have not scored more than 19 points against an FBS opponent in regulation. Think about that. That is awful. They beat South Carolina State 49-3 in week 2, but South Carolina State is an FCS team. That doesn’t count. They scored 21 points against NC State in a loss in week 3, but that was in OT.
The obvious objection is that Clemson played Georgia really close in week 1 and only lost because of a pick-six in a 10-3 game. But given what we’ve seen from Clemson since week 1, I think that’s more a reflection on Georgia than it is on Clemson. In other words, it’s not so much that Clemson deserves credit for playing Georgia tough, but that it’s a concern for Georgia that they struggled with Clemson.
I know that’s controversial given that the consensus is that Georgia is the best team in the nation this year, but given what we’ve seen out of Clemson since that game, how can you look at it any other way? If your takeaway from that game is that Clemson is almost as good as Georgia, then why has Clemson sucked in almost every game since?
If anything it’s an indication that we’re possibly overrating Georgia.
Now, I still think Georgia is really good–Championship-caliber. But much of the reason we think Georgia is so good comes from them beating Clemson in week 1, when Clemson was ranked in the top-5. The case for Georgia is on somewhat of a shaky foundation. I know I’m nitpicking here because Georgia has been great this year. And I did pick them to win the National Championship.
But still. The win against Clemson kicked off the whole Georgia lovefest that has been ongoing since week 1, but by now it’s pretty obvious that Clemson sucks.
The more interesting team to me is Iowa State, which, again, FPI has at 8 and I have at 35. Why the discrepancy?
Well, Iowa State gets credit for ranking 19th in net scoring margin, which I double weight. They’re 6th in net yards per game, 7th in net yards per play, and 13th in big play margin. However, they are atrocious on special teams and in field position (123 and 101 respectively), they have played the 60th toughest schedule, they’re 58th in turnovers, and they’re 57th in talent, which is my most important category and triple-weighted.
Now, you can still rank very highly despite being at a talent deficit against the top teams. I have Baylor at 5 and Cincy at 7, and those two are ranked 41st and 54th in talent respectively. But they also rank really highly in every other category other than strength of schedule.
My ratings take strength of schedule heavily into account: in addition to strength of schedule itself, I also use strength of record, which takes SoS into account, as well as Game Control and Average In-Game Win Probability, both of which take SoS into account.
Again, I think the reason FPI is so much higher on Iowa State than I am is that FPI factors in stuff from last season, while my ratings do not.
I’m not saying FPI is wrong and I’m right. I don’t know who’s right or wrong. That’s the whole point of doing this: to see if I’m able to create a reasonably predictive power rating system. If it doesn’t work out, then I go back in the lab and tweak the formula until I get something that’s predictive.
For what it’s worth, my NFL power ratings last season were pretty damn good if I do say so myself, so that’s why I’m sticking to largely the same formula for this season in the NFL. But the college football power ratings use a much different formula than the NFL one, so time will tell how accurate they are.
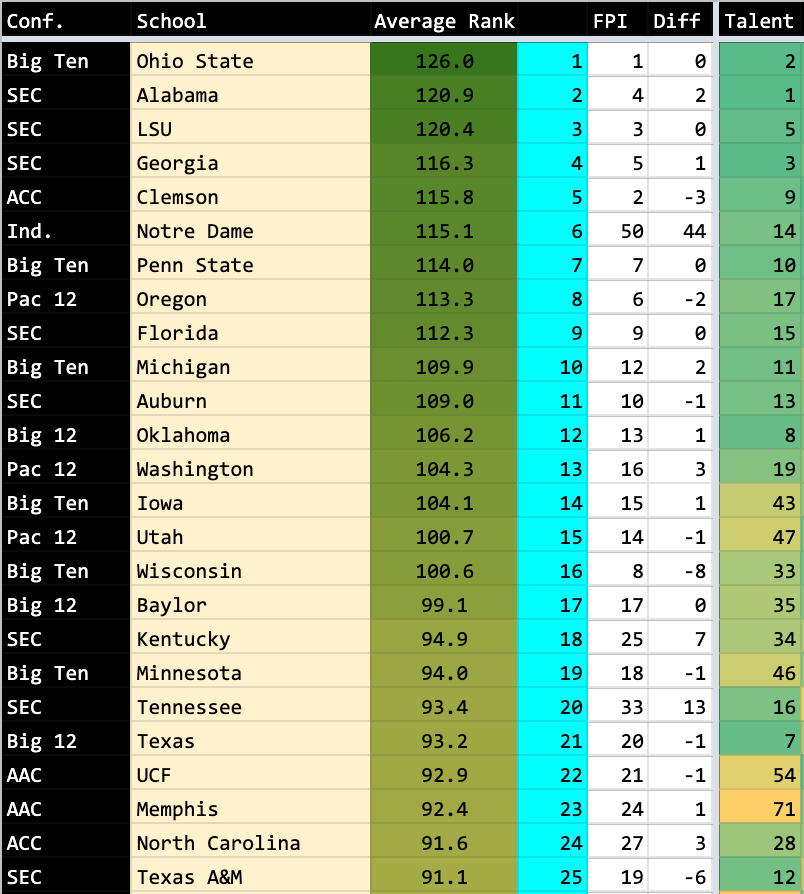
If you’re interested in what the ratings for 2020 would have looked like, I plugged 2020’s numbers into the formula and this was the top-25 I got. Keep in mind it’s based on final numbers, so after all the bowl games were played:
I know the obvious issue is that it underrated Ohio State, who blew out Clemson in the playoff. 2020 was obviously the Covid year, and Ohio State only played 8 games in the regular season and didn’t look all that great in at least a few of them (Indiana and Northwestern come to mind). But Ohio State was still elite in all the categories–except for one: special teams, where they were utterly abysmal, ranking 107 overall. That really dragged down their overall power rating. If you change them to #15 in STR as opposed to 107, they shoot up to 121.5, which would have been good for #2 overall in the country and ahead of Clemson.
So that then begs the question, are we weighting special teams too much? Obviously Ohio State’s lackluster special teams didn’t hold them back against Clemson in the playoff last year. So should I nix the category? Well, I’m not going to do it just yet because of what I was talking about yesterday: how we overvalue the results of individual games. These power rating systems are not really designed to predict the results of individual games–they’re more a starting point for evaluating these teams. Matchups matter, too. Some teams just match up really well with other teams. Motivation matters–Dabo ranked Ohio State 11th last year and it gave Ohio State some extra motivation to really take it to Clemson. There’s so many things other than what I plug into the ratings formula that decide the outcomes of individual games.
Basically what I’m saying is that while Ohio State beat Clemson 49-28 in the playoff last year, it’s not as if they would do that to Clemson if they played 10 games in a row against each other.
This is all such a messy business that really the best we can do is establish some sort of reliable power rating formula and then, for individual games, factor in things like injuries, weather, home field advantage, and recent performance.
And that first part–the reliable power ratings–is what I’m trying to do here. Eventually I’m going to try to figure out how to convert that into predicted points in a given matchup, but that’s a ways off. I have no idea how to do that. That’s like the Holy Grail of this type of thing. Vegas obviously does not share its formula for how the major books set lines and point totals, but my goal is to try to figure it out.
Anyway, it’s worth noting that last year, Bama was a 125.6 but this year they’re a 124.0. You can see just how far ahead of everyone else Bama was last year. 2020 Bama was truly a historically great team.
I also plugged the numbers in for 2019, and the result kind of surprised me, but then when I thought back to the season it really wasn’t a huge surprise:
Both my ratings and FPI had Ohio State as the #1 team in the country. My ratings had them as far and away the best team in the country, too. In fact they rated even better than 2020 Alabama.
When we think back to that 2019 season, we think about how LSU was so great, went 15-0, Joe Burrow won the Heisman and set all kinds of ridiculous passing records, etc. I mean you look LSU’s resume that year, they beat so many good teams: Bama, Clemson, Georgia, Florida, Auburn, Oklahoma. The Clemson, Georgia, Oklahoma, Texas A&M and Florida games were all blowouts (2 or more TD margin). They also beat Texas on the road early in the season. We came away from that season thinking that LSU team might be one of the best in college football history, if not the very best.
Ohio State had a great resume as well, beating Wisconsin twice, Penn State and Michigan, plus Florida Atlantic who was thought of as a cupcake when Ohio State played them (the game was 45-21) but who actually ended up being ranked inside my top-25 by the end of the season. Ohio State also beat Cincinnati 42-0 early in the season, but that Cincinnati team went on to finish 11-3 that year. But LSU’s was resume was still unquestionably better. 2019 LSU might have had the best resume ever honestly.
The issue here is that Ohio State lost a real heartbreaker to Clemson in the semifinal, and Clemson ended up getting thrashed pretty good by LSU in the National Championship, so we just kind of assume Ohio State would have fared about the same against LSU as Clemson did.
But if you go back and look at that Ohio State-Clemson semifinal, you can see why Ohio State was ranked higher. They moved the ball much better than Clemson did all game. Ohio State’s problem was that they couldn’t finish drives off in the redzone. They could’ve put Clemson away really early in that game but had to settle for field goals. They also let up some big plays that allowed Clemson to climb back into the game. Really outside of a few big plays, Clemson wasn’t getting much going on offense, and only was able to get stops on Ohio State in the red zone. The refs also screwed Ohio State a few times in that game, but ultimately Ohio State beat themselves.
The point is, I don’t think it’s such a given that LSU would have handily beat Ohio State in the National Championship if Ohio State had managed to beat Clemson in the semifinal. I don’t know if Ohio State would’ve been able to beat LSU, but I think it would’ve been closer than the Clemson game was.
The point here is that we shouldn’t discard the rating system just because it had Ohio State as the best team in 2019, when everybody knows it was LSU.
Ratings are about likelihoods, probabilities. If 2019 Ohio State and 2019 Clemson played each other 10 times in a row, 2019 Ohio State probably wins the majority of the games. But in the actual, IRL game they played, Clemson won. That doesn’t mean 2019 Ohio State isn’t as good as 2019 Clemson, it just means that on that day, when they met on the field, Clemson was a bit better.
Take a look at 2019 Bama vs. 2019 LSU: we know LSU won the game 46-41 in Tuscaloosa, and LSU was up 33-13 at halftime in the game. But what we forget is that Tua had ankle surgery three weeks before the game and was clearly not 100% during the game. He was visibly limping all game. With a fully healthy Tua, might that game have gone differently? We’ll never know.
I know it seems like I’m trying to just poke holes in 2019 LSU’s accomplishments, but the point I’m trying to make here is that it’s not so crazy that the power ratings had Ohio State and Alabama ahead of them.
Sometimes, for any number of possible reasons, the actual, real life games don’t play out the way the ratings expect them to play out. This is why you hear analytics guys always talk about “randomness” in sports–because they’re trying to create a system that will be able to reliably predict the outcome of every game, but simply due to the nature of sports where crazy and unexpected things happen all the time, you will never actually be able to nail every game. As they say, the football bounces in weird ways.
It’s the reason they play the games instead of letting computers just pick the national champion.
In terms of betting, of course, the goal is not to build a system that gets every game right, because that’s simply impossible. The goal is to figure out how to project point spreads and point totals, and then get something like 53-55% of your projections correct in order to make money.
