
We’re through three weeks (for some teams, four) so I think I’ve got enough data to start compiling the power ratings. Now, granted, most teams have played just non-conference opponents thus far, so we still don’t really know just how “real” a lot of these teams are. (Michigan, for example, which has played the weakest schedule in the FBS–131 out of 131.)
But I think after three games–a quarter of the regular season–we’re starting to get a picture of which teams are good and which teams are bad. Obviously the picture doesn’t come fully into focus until January, but three weeks into the season we’re starting to understand things.
There are still going to be some eyebrow-raising results ahead, like UCF ranked 12th in the country and Minnesota ranked #10. And even Tennessee at #5.
But these rankings take strength of schedule into account. And they take talent level into account as well. In fact, SoS is double-weighted and talent is triple-weighted. (The other categories that are double weighted are Net Points Per Game and Net Yards Per Play–I’ll explain all the categories in a minute).
So what these rankings show us is that, yes, while teams like Michigan and Minnesota–who have the 131 ranked and 130 ranked SoS respectively–have played incredibly easy schedules, they have taken care of their business against those easy schedules. They’ve been dominant. That’s really all you can ask of them–the schedule is the schedule. It’s what you do against the teams on your schedule that counts.
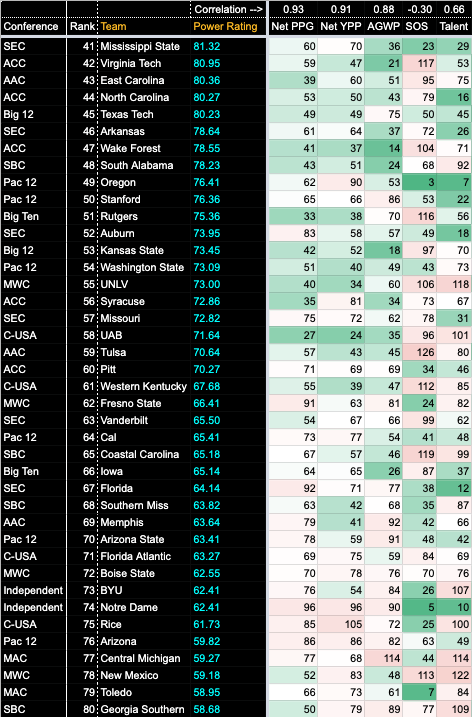
So here are the initial ratings after three weeks of play, just the top-80 teams:
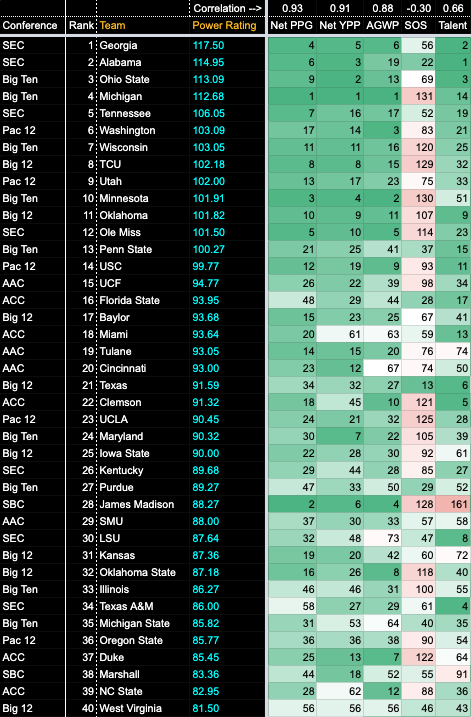
Georgia is in a class of their own up at the top, then Bama, Ohio State and Michigan are grouped pretty close and in a tier of their own. If you look over at the composite talent ratings on the far right, Michigan is the clear outlier there as they’re ranked 14th in talent while Georgia, Bama and Ohio State are 2, 1 and 3 respectively. But Michigan has played a pathetic excuse of a schedule, so that’s why they’re statistically as dominant as the Big Three have been.
Some other notable teams:
- My ratings despise Clemson. They’re 22nd. I’ve been trying to tell you all Clemson is fraudulent. Their QB has a low ceiling, Dabo is a cornball, and they are going to notice the absence of Brent Venables on that defense. And Tony Elliott on offense. Clemson just lost their offensive coordinator who had been there 7 years, and their defensive coordinator who had been there a decade. You do not just lose those guys and not miss a beat. Clemson has played an insanely easy schedule (121) and they have not been particularly dominant.
- Clemson is mediocre passing the ball: 82nd in net pass yards per game, 62nd in net pass YPA, 87th in net completion percentage. They’re really just not elite in any category other than maybe Net Rush Yards Per carry, where they rank 15th, and Net Red Zone TD%, where they rank 11th. However, they have the 5th best roster in the country per 247, and that buoys them quite a bit.
- Ratings are very favorable towards Tennessee, which is crazy because I feel like Tennessee is the false alarm of college football lately. There’s always a point in the season where we’re like, “Wait, is Tennessee actually good this year?” But then they fall apart. It still could happen this year, but I don’t think my ratings have ever liked Tennessee quite as much as they like them this year (then again I’ve only been doing them since 2020).
- Tennessee is at least good in just about every category other than special teams. They’re a bit lacking in Net Rush YPC, which is a legit concern, but they have an explosive offense under Josh Heupel. That’s what Josh Heupel does well: his teams are always extremely competent offensively. A bit of an unproven asterisk next to the Vols, naturally, but they’ve played a respectable schedule, at least one game: they went on the road and beat #17 Pitt a couple of weeks ago. So they’re not completely untested.
- Big matchup comes against Florida this weekend in Knoxville, the traditional rivalry game with College Gameday on campus. People will be surprised to see Tennessee favored by 10.5, but my ratings are really low on Florida this season and I think Tennessee covers.
Obviously there are some other big name teams in there that I haven’t covered, but I really don’t want to spend too much time here because this is so early in the season and these ratings are subject to changing, perhaps significantly over the course of the season. So I don’t really want to dwell on these initial power ratings this early in the season.
Now I want to get into the components–what stats actually make up these ratings? Well, they are as follows, except for one category:
- Net Points Per Game (double weighted): Your team’s points scored per game minus points allowed per game.
- Net Yards Per Play (double): Your offense’s average yards gained per offensive play minus the average amount of yards your defense allows per opponent play. This is one of the most important stats in college football and really tells you a lot about how good a team is. My top-4 teams rank 3, 5, 2 and 1 in Net YPP respectively. It is not a coincidence. Net YPP is highly predictive of team success in college football.
- Strength of Schedule (double): As defined by ESPN’s FPI. It’s the way we contextualize a team’s accomplishments.
- Net Total Yards (single): Total yards gained minus total yards allowed, per game.
- Net Passing Yards Per Game (single): How many passing yards your team averages per game vs. how many passing yards you allow per game.
- Net Passing Yards Per Attempt (single): How efficient you are passing the ball vs. how efficient your opponents are passing the ball on you. Yards per attempt is a way more useful metric of passing efficiency because it can’t be “tricked” by QBs that inefficiently throw a high volume of passes for a lot of yardage. It’s a lot more impressive if you have 350 yards on 30 passing attempts (11.7 YPA) than if you have 350 yards on 50 passing attempts (7.0 YPA), right?
- Net Turnovers Per Game (single): Now this is a tough one, and I always debate excluding it. The idea is that turnovers are “random,” or at least inconsistent, in the sense that you can’t count on them from game to game and yet the impact the game so much. They are, while not fully “luck-based,” definitely definitely volatile on a weekly basis. A DB drops a sure pick vs. making the catch. A QB is sacked and fumbles the ball, but recovers it vs. loses it. There’s just inherently a lot of wonkiness and flukiness involved in turnovers. Last year, I thought Iowa was overrated because they had gotten a ridiculous amount of turnovers to go their way while not committing a lot of them. Teams should definitely be given credit for not turning the ball over, as that’s key to winning games, but getting turnovers on defense is not quite as clear.
- Then again, you could easily make the argument that the better and more dominant a defense is, the more turnovers it forces. You think of the greatest defenses in football history–NFL or college–and what do they have in common? They’re so good they are almost playing offense on defense, in that they are looking to take picks and fumbles back to the house for six all the time, because they’re good enough to play like that. So I can’t just fully exclude the net turnovers category from my ratings. This is why it’s a dilemma.
- But then again, Net Turnovers as a statistic are not really correlated with a team’s overall power rating score in my system. In fact, Net Turnovers only have a correlation of r = 0.30. Compare that to Net Total Yards, where r = 0.91.
- I think I’ll keep Net Turnovers for now. If anything, it just shows us how reliant a team is on favorable turnover luck, which can help us Detect Frauds. Perhaps later in the season I’ll change it to simply giveaways, with the team that turns it over the least being ranked #1.
- Net Completion % (single): Your offense’s pass completion rate minus the completion rate your defense allows the other team.
- Net Rush Yards Per game (single): Your rush yards per game minus rush yards allowed.
- Net Rush Yards Per Carry (single): Your yards per carry minus yards per carry allowed. This is different from rush yards per game, as it tells us a lot more. It tells us how efficient your run game is, and how good you are at stopping the run.
- Net First Downs (single): Your first downs gained per game minus first downs allowed.
- Special Teams Rating (single): In the interest of expediency, I just outsource this to Football Outsiders and use their all-encompassing special teams rating. From their website: “Special teams Fremeau Efficiency Index ratings (STR) combine kickoff return, kickoff, punt return, punt, and field goal efficiency into one overall rating, represented as the team’s standard deviation above or below average.” I wanted to have a special teams component in the ratings system, but I didn’t want it to be too much of the formula, so I just use the STR stat.
- Net Third Down% (single): Your team’s third down conversion rate minus third down conversion rate allowed.
- Net Red Zone TD% (single): The rate that you score a TD on your red zone trips minus the rate that you allow opponents to score TDs on their red zone trips. This is a hugely important stat. Getting 7 in the red zone versus getting 3 is crucial. The best teams get touchdowns in the red zone while holding their opponents to field goals.
- Net Big Plays (single): Big plays defined as plays of 20+ yards. How many you get minus how many you allow your opponents to get. The best teams pick up yards in bunches while forcing their opponents to pick up yards in small increments. Big plays are game-changers, and the best teams get the most of them while allowing the fewest.
- Trenches (single): This is an all-encompassing stat that I haven’t yet incorporated into the ratings, because Football Outsiders only starts calculating line of scrimmage data in week 4 of the season. But essentially it tells you how well a team controls the line of scrimmage. There’s a lot that goes into it, but what I do is net out the following, and average them all into a single number. Here is what goes into it, from Football Outsiders’ website
- Line Yards per Carry: For 2018, we are experimenting with a new definition for college line yardage based on film study and generalization. Instead of the ALY figure FO used for the NFL, this one is tighter: the line gets credit for rushing yardage between 0-3 yards (instead of 0-4) and 50% credit for yards 4-8 (instead of 5-10). Anything over 8 yards is quantified as a highlight opportunity, and credit goes to the runner. As with the pro definition, lost yardage still counts for 125%. (Garbage time is filtered out for all line yardage averages.)
- Standard Downs Line Yards per Carry: The raw, unadjusted per-carry line yardage for a team on standard downs (first down, second-and-7 or fewer, third-and-4 or fewer, fourth-and-4 or fewer).
- Passing Downs Line Yards per Carry: The same unadjusted averages for rushing on passing downs.
- Opportunity Rate: The percentage of carries (when four yards are available) that gain at least four yards, i.e. the percentage of carries in which the line does its job, so to speak.
- Power Success Rate: This is the same as on the NFL side — percentage of runs on third or fourth down, two yards or less to go, that achieved a first down or touchdown.
- Stuff Rate: Same as STUFFED on the NFL side — percentage of carries by running backs that are stopped at or before the line of scrimmage.
- Sack Rate: Unadjusted sack rate for all non-garbage time pass attempts.
- Standard Downs Sack Rate: Unadjusted sack rate for standard downs pass attempts.
- Passing Downs Sack Rate: Unadjusted sack rate for passing downs pass attempts.
So that’s what goes into my power ratings.
They’ll get better and better as the season goes on. Last year, I was all over Alabama when they played Georgia in the SEC Championship Game. My ratings liked Bama more, and they won. I also had Michigan as 39 points better than Iowa on a neutral field, and Michigan beat Iowa 42-3 in the Big Ten Championship Game. Not to toot my own horn or anything.
