
During the NFL season, I compiled team statistical rankings so that I could get a more objective read on which teams were the best and which teams were overrated. It was fairly predictive, although not perfect, but the one thing I’ll credit it with was convincing me to not give up on the Tampa Bay Buccaneers. There was a point during the regular season where everyone was bailing on the Bucs, but my statistical rankings were telling me that the Bucs were still a really good team.
I enjoyed compiling the statistical ranks, so I wanted to do something for the NBA. I figured I’d just do the same thing as I did for the NFL statistical rankings: take all the most important categories and average out every team’s ranks to find out which team has the best average across all the statistical categories.
But since the NBA is a very star-driven league, I would have to find a way to incorporate star players into my NBA statistical rankings. At first I was just going to use Hollinger’s PER, but I found that PER doesn’t really translate well to overall player rankings, as it’s very biased toward big men. For instance, according to PER, Clint Capela is the 12th best player in the league and James Harden is the 13th. I’m not saying PER is a junk stat, because for the most part, it gets things pretty close to correct. But there’s some quirks in there that I didn’t like.
So I came up with my own all-in-one NBA player statistic, and I call it “Total Net Contribution.” It takes all the things a player does in a game–good and bad–and nets them out. The higher the number, the better.
I’ll get into the formula quickly before unveiling the first rankings. The formula is as follows:
- Points per game +
- Rebounds per game +
- Steals per game +
- Blocks per game +
- Points generated via assist per game (*0.8) +
- Free throws made per game +
- Defensive Real Plus/Minus +
- Effective field goals made per game –
- Effective field goals missed per game –
- Free throws missed per game –
- Turnovers per game
= - Total Net Contribution
It’s the good things you do minus the bad things you do on a per-game basis. Other than DRPM, which is a per-100 possessions stat, but that’s pretty close to per-game.
A few points about the formula:
- I use effective field goals per game rather than just field goals. I want it to incorporate three point shooting, so eFG is the way to go. Because if you just use normal field goal percentage, it doesn’t take into account that a three pointer is worth more than a 2, and thus shooting 40% from three is actually really good even though from an overall field goal percentage perspective it looks really bad.
- To illustrate, if you shoot 10 two-pointers and hit 50% of them, you’ve scored 10 points. But if you shoot 10 threes and hit 40% of them, you’ve scored 12 points. This is why I use effective field goal percentage for my ranks. It’s just more accurate and fair.
- My ranks are biased toward passers because I include total points generated via assist per game. Basketball Reference keeps track of this stat, and it gives you a better look at how truly valuable great passers are. Assists per game don’t really tell the whole story. Assists lead directly to points. The NBA doesn’t just hand them out willy-nilly; the pass has to lead directly to a bucket to be counted as an assist in the official box score. It’s hard to get credited for an assist. So I wanted my rankings to reflect the true value of passers–the guys who make the offense work and create scoring opportunities for their teammates.
- Now, I did multiply the PGA Per Game number by 0.8, so a guy does not get full credit for points scored by his teammates. Because giving PGA a 1:1 ratio with PPG just seems wrong to me. And I’m open to adjusting the weighting in the future as well. But for now we’ll go with players getting credit for 80% of the points they generate via assist. I’m sure some basketball nerd has done all the research and found out exactly what percentage of a point an assist is worth, but I’m going with 80% for now.
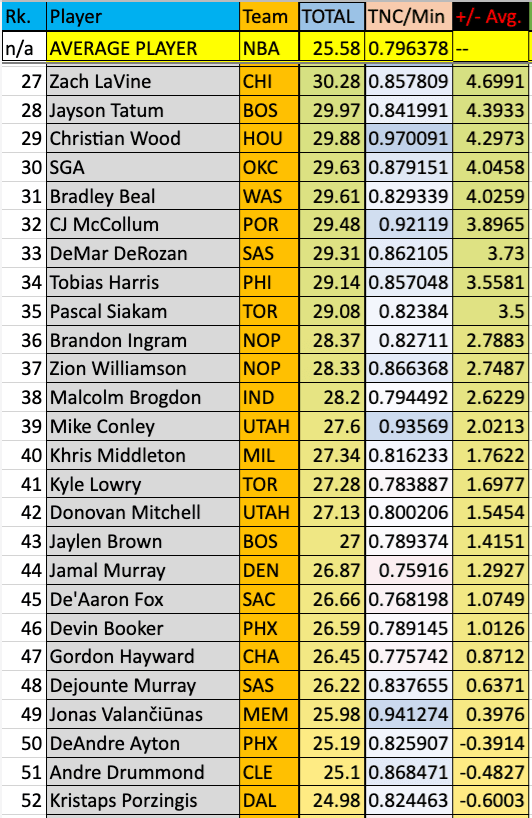
The chart will show the player’s rank, his total TNC, his total TNC divided by minutes per game, and then finally the “+/- Avg.” column shows how much more or less he contributes to his team over the average, per game.
Now for the Top 26:

My top player in the league for 2021 as of 3/25/21 is Nikola Jokic, followed by James Harden, Giannis, Joel Embiid, and Luka Doncic. LeBron is #6.
The MVP hype for Nikola Jokic is justified.
What’s interesting is that despite leading the league in scoring at 31.8ppg, Bradley Beal only ranks 31st in the league in TNC. He’s barely ahead of CJ McCollum.
The reason for this is that he’s a liability on defense as measured by DRPM. And although Beal is definitely not inefficient, he’s not what I would call a highly efficient scorer. He’s averaging almost 23 shots a game.
Also, the recently-executed trade that sent Nikola Vucevic to the Bulls should be great news for Chicago: Vucevic is ranked as the 12th-best player in terms of total net contribution. He’ll join Zach LaVine, who I have as the 27th best player in the league in terms of TNC.
It’s important to note that these are just statistical rankings. It’s not “how good a player is, period” it’s how good his stats are. There’s obviously a subjective aspect to ranking these players and that’s not factored in here. I think Steph Curry is better than the 15th-best player in the league, for instance.
Then again, maybe I only think some of the statistical rankings are wrong because I’m wrong in terms of my subjective opinions. As I wrote with the NFL rankings, just because they don’t confirm your pre-existing opinions and biases, it doesn’t mean the rankings are wrong. Your opinions might be wrong.. Nor are the rankings right when they confirm to us what we already thought was true.
So this is important to keep in mind with statistics in general.
It’s possible these rankings take defense into account too much. I’ve included blocks per game, steals per game, and Defensive Real Plus/Minus, a stat that tracks how much better a player’s team is on defense when he’s on the floor, per 100 possessions. It’s not easy to find exactly which stats ESPN factors into DRPM, but I’m assuming blocks, rebounds and steals are included, meaning I might be over-weighting defense here. Points and rebounds might be slightly redundant when DRPM is also factored into the formula.
Like the NFL statistical rankings, these rankings are fluid and they will probably be tweaked over the course of the season as I keep researching NBA statistics.
But now that we have the player rankings, we can begin on the team statistical rankings, because they have a lot to do with superstar rankings.
Just off the bat, let’s take a look at some of the best 1-2 punches according to the list:
- The Nets are obviously loaded, featuring #2 (Harden), #11 (KD) and #17 (Kyrie) in the rankings.
- Philly: #4 Joel Embiid, #20 Ben Simmons
- The Heat: #8 Jimmy Butler, #13 Bam Adebayo. They also added Oladipo, who I have as #53.
- The Clippers: #9 Kawhi, #16 Paul George
- The Wizards: #23 Russell Westbrook, #31 Bradley Beal
LeBron is ranked #6, and Anthony Davis is ranked down at #25, but I think most people would agree that Anthony Davis is better than the 25th best player in the league. The thing with AD is, his stats were just down across the board this year in the short amount of time he was playing. That’s why he’s so lowly-ranked. Whether it was because he just wasn’t well-rested after getting a very short offseason, or he was dealing with nagging injuries, I don’t know; he just didn’t post typical AD numbers this year even when he was playing.
Just to show you how different AD’s numbers are in 2021 vs. last season: right now AD’s TNC number is 28.75. Last season he was a 33.97, which would’ve been good for 14th overall this season.
But again, and this goes for every player on this list, and with sports statistics in general: it’s impossible to quantify everything about a player. There is no statistic that is perfectly predictive of who’s going to lead their team to a championship. Jokic is ranked #1, and by a decent margin over #2 Harden, but does anyone really consider the Nuggets the championship favorites this year?
So statistics in general are not the be-all, end-all. There’s so many intangibles that factor in, and yet we have on way of quantifying them.
Anyway, those are the rankings. Team rankings coming soon.
Here’s the remainder of the rankings. I did rankings for 104 players:


[…] net contribution rank of a team’s best player. TNC is the player-ranking formula I created (more information here). Essentially it’s a way to rank the best players in the league. Including star player ranks […]
LikeLike